

Top 50 Generic Pharmaceutical Companies in India
Pharmarack reported the Indian pharmaceutical market grew 8.4% in FY25 to over ₹2.25 lakh crore, with cardiac (10.8%), gastrointestinal (10.2%), and anti-diabetic (8%) therapies leading value growth. For strategy and BD teams tracking the top 50 generic pharmaceutical companies in India, the real question is not just who is biggest. It is where revenue is concentrating, which therapy franchises are shifting, and which private players are quietly climbing the ranks without public disclosures. This ranking is built to answer those questions, with every number traced to a named source.
Unlike most listicles that recycle the same ten names with rounded figures, this piece separates audited annual-report revenue from rating-agency estimates and IQVIA domestic audit data. Where a private company does not publicly disclose, we say so. Where a figure is an estimate, we flag it. The goal is a ranking strategy teams can actually defend in a boardroom.
How This Ranking Was Built: Methodology and Limits
The primary ranking metric is total reported revenue for FY2024-25 (April 2024 to March 2025), in ₹ crore. For listed companies, figures come from audited annual reports and stock exchange filings, aggregated from stock exchange filings and audited annual reports. For private companies, we use credit rating agency rationales (CRISIL, CARE Edge) and Ministry of Corporate Affairs (MCA) filings where available. A third source, IQVIA TSA domestic MAT data cited in Motilal Oswal and HSIE broker reports, is used for companies that do not disclose total revenue but have a measurable domestic formulation footprint.
Three caveats matter for anyone using this list for competitive benchmarking:
- Total revenue is not domestic formulation revenue. Companies like Divi’s Labs, Granules, Laurus Labs, and Syngene derive most of their revenue from API exports or contract manufacturing, not from Indian retail generics. Ranking them alongside Sun Pharma or Cipla by total revenue is apples-to-oranges. The therapy focus column helps you separate pure domestic formulation players from API and CDMO models.
- Private company figures are estimates. Intas, Macleods, Aristo, USV, and Hetero do not publish audited annual reports. Their figures here come from rating agency provisional numbers, MCA filings, or industry estimates, and are marked accordingly. Treat them as directional, not precise.
- IQVIA domestic MAT is a covered-market audit. The IQVIA Indian Pharmaceutical Market (IPM) data covers retail chemist sales in the audited universe, not institutional sales, exports, or direct-to-hospital channels. Companies ranked 35 to 42 are placed by IQVIA domestic MAT share because their total revenue is not publicly available. This is explicitly flagged in the Basis column.
The Indian Pharma Market itself grew 8.4% in FY25 per Pharmarack, with unit growth of just 1.2%, meaning most of the growth was price-driven. IQVIA’s Q2 2025 quarterly insights put the IPM at ₹61,000 crore for the quarter (April to June 2025), with 9% year-on-year growth. Indian companies held 83% market share versus 17% for MNCs, as per the IQVIA Q2 2025 report.
Top 50 Generic Pharmaceutical Companies, Ranked
The table below ranks companies by FY25 total reported revenue. The Basis column tells you exactly where each figure comes from: AR means audited annual report of a listed company, RA means rating agency rationale, MCA means Ministry of Corporate Affairs filing, and IQVIA means the company is ranked by domestic IPM MAT share because total revenue is not publicly disclosed. ND means no public figure was available at the time of writing.
| Rank | Company | FY25 Rev (₹ Cr) | Basis | Therapy Focus | Notable Strategic Move |
|---|---|---|---|---|---|
| 1 | Sun Pharma | 52,041 | AR | Dermatology, chronic, specialty | Global Specialty scale-up |
| 2 | Dr Reddy’s Labs | 31,632 | AR | Generics, biosimilars, API | Nicotine patch OTC launch |
| 3 | Aurobindo Pharma | 31,378 | AR | Antibiotics, ARV, generics | US generics volume leader |
| 4 | Cipla | 27,145 | AR | Respiratory, cardiac, anti-infective | Respiratory franchise expansion |
| 5 | Zydus Lifesciences | 22,574 | AR | Generics, biosimilars, wellness | Consumer wellness demerger |
| 6 | Lupin | 22,192 | AR | Cardiac, diabetes, anti-infective | Complex generics pipeline |
| 7 | Intas Pharma | ~19,900 | Est. | Cardiac, CNS, oncology biosimilars | Biosimilar scale-up (private) |
| 8 | Biocon | 15,052 | AR | Biosimilars, insulin | Vertically integrated biosimilars |
| 9 | Glenmark Pharma | 13,146 | AR | Dermatology, respiratory | Life sciences demerger |
| 10 | Alkem Labs | 12,964 | AR | Cardiac, GI, anti-infective, dermatology | US specialty scale-up |
| 11 | Mankind Pharma | 12,207 | AR | Acute, OTC, women’s health | Acquired BSV (Bharat Serums) |
| 12 | Torrent Pharma | 11,317 | AR | Cardiac, CNS, GI | Acquiring JB Chemical stake |
| 13 | Macleods Pharma | 9,383 | RA | Anti-infective, cardiac, CNS | Private; zero debt |
| 14 | Divi’s Labs | 9,360 | AR | API, custom synthesis | API and nutraceutical API |
| 15 | Piramal Pharma | 9,151 | AR | CDMO, generics, OTC | Hospital injectables scale-up |
| 16 | Emcure Pharma | 7,896 | AR | Cardiac, GI, gynecology | Sanofi cardio portfolio deal |
| 17 | Jubilant Pharmova | 7,192 | AR | APIs, generics, CDMO, radiopharma | Radiopharmaceutical expansion |
| 18 | Alembic Pharma | 6,672 | AR | Cardiac, dermatology, GI | US complex generics filings |
| 19 | Abbott India | 6,409 | AR | Diabetes, cardiac, GI (MNC) | Top IPM rank by MAT growth |
| 20 | Gland Pharma | 5,617 | AR | Injectables, CDMO | Acquired Cenus Pharmaceuticals |
| 21 | Laurus Labs | 5,554 | AR | API, ARV, oncology generics | Fermentation and Synthesis API |
| 22 | Aristo Pharma | 4,941 | MCA | GI, anti-infective, cardiac | Private; 31.7% net margin |
| 23 | USV | 4,813 | RA | Diabetes (OAD), cardiac | Private; ~13% OAD market share |
| 24 | Ajanta Pharma | 4,648 | AR | Cardiac, ophthalmology, dermatology | Branded generics in emerging markets |
| 25 | Strides Pharma | 4,565 | AR | Anti-infective, generics | Returned to profitability FY25 |
| 26 | Granules India | 4,456 | AR | API, generics (paracetamol leader) | Paracetamol API global share |
| 27 | Natco Pharma | 4,430 | AR | Oncology generics, Hep C | Complex oncology and crop health |
| 28 | JB Chemical and Pharma | 3,918 | AR | Cardiac, GI, ophthalmology | KKR to Torrent stake transfer |
| 29 | GSK Pharma | 3,749 | AR | Vaccines, dermatology (MNC) | Declining IPM share (46 bps over 5 yrs) |
| 30 | Syngene International | 3,642 | AR | CDMO, research services | Not a generics company (CDMO) |
| 31 | Wockhardt | 3,012 | AR | Biosimilars, generics | Insulin biosimilar focus |
| 32 | Eris Lifesciences | 2,879 | AR | Metabolic, dermatology | Acquisition-driven growth (44.6% YoY) |
| 33 | Dishman Carbogen | 2,712 | AR | API, CDMO | CDMO and CRAMS focus |
| 34 | Marksans Pharma | 2,623 | AR | Generics, OTC | UK and US OTC generics |
| 35 | Ipca Labs | ND (listed) | IQVIA | Pain, cardiac, anti-infective | IPM rank 16; 2.1% MAT share |
| 36 | Micro Labs | ND (private) | IQVIA | Cardiac, GI, dermatology | IPM rank 19; 1.6% MAT share |
| 37 | Sanofi India | ND (listed) | IQVIA | Diabetes, cardiac (MNC) | IPM rank ~22; cardio portfolio to Emcure |
| 38 | FDC Ltd | ND (listed) | IQVIA | Ophthalmology, oral rehydration | IPM rank ~24; Electral franchise |
| 39 | Himalaya Wellness | ND (private) | IQVIA | Herbal, OTC | IPM rank ~25; not strictly generics |
| 40 | La Renon | ND (private) | IQVIA | Nephrology, dermatology | IPM rank ~27; specialty focus |
| 41 | Franco-Indian | ND (private) | IQVIA | GI, generics (MNC) | IPM rank ~29 |
| 42 | Corona Remedies | ND (private) | IQVIA | Generics, nutrition | IPM rank ~30 |
| 43 | Hetero Labs | ND (private) | ND | Biosimilars, generics, API | Major private generics and biosimilars |
| 44 | Indoco Remedies | ND (listed) | ND | Generics, contract manufacturing | Listed; retrieve from annual report |
| 45 | Unichem Labs | ND (listed) | ND | Generics, API | Listed; retrieve from annual report |
| 46 | Morepen Labs | ND (listed) | ND | Generics, OTC, devices | Listed; retrieve from annual report |
| 47 | Panacea Biotec | ND (listed) | ND | Vaccines, generics | Listed; retrieve from annual report |
| 48 | Themis Medicare | ND (listed) | ND | Generics, APIs | Listed; retrieve from annual report |
| 49 | Albert David | ND (listed) | ND | Generics, IV fluids | Listed; retrieve from annual report |
| 50 | Shilpa Medicare | ND (listed) | ND | Oncology generics, APIs | Listed; retrieve from annual report |
Reading the gaps. Ranks 35 to 50 are where public data stops being reliable for total revenue. Ipca Labs is a listed company with significant domestic and export business, but its total FY25 revenue was not retrieved in this compilation; its IQVIA domestic MAT value was approximately ₹4,671 crore as of December 2024 per broker data. Micro Labs, Hetero, La Renon, Franco-Indian, and Corona are private companies that do not publish annual reports. If your company belongs in this range, the best way to get accurately ranked is to share your audited revenue with the research team at Pharmarketin.com.
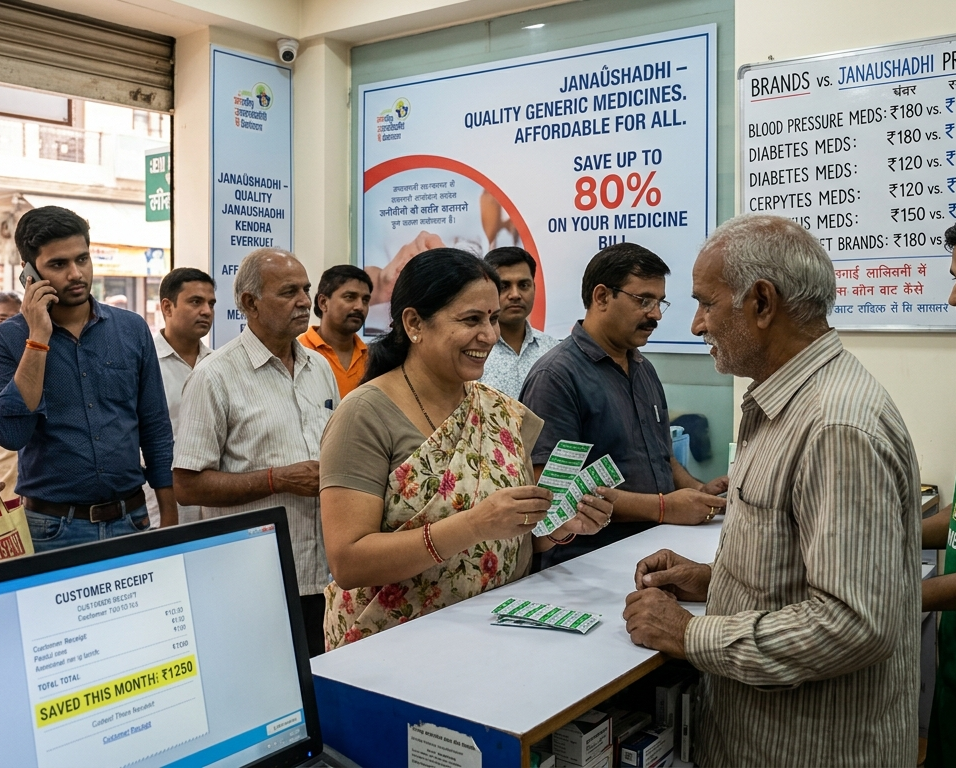
For a deeper look at how Indian consumers perceive generics versus branded medicines, which directly affects the commercial context these companies operate in, see our earlier analysis on consumer views on medicine quality and savings.
Therapy Focus and Geography at a Glance
Chronic versus Acute: Where the Growth Is
The chronic segment (39% of IPM) grew 10% year-on-year in January 2025, while the acute segment (61% of IPM) grew 6.3%, per Motilal Oswal data sourced from IQVIA. This split explains why companies with cardiac, diabetes, and CNS franchises are outperforming those weighted toward anti-infectives and respiratory acute therapies. Cardiac therapy grew 10.8% in FY25 per Pharmarack, followed by GI at 10.2% and anti-diabetic at 8%.
Companies most exposed to chronic growth: Sun Pharma, Torrent, Intas, JB Chemical, and IPCA, all of which posted double-digit IPM MAT growth in recent quarters. Companies most exposed to acute pressure: Alembic (which saw negative MAT growth in December 2024), and GSK (which lost 46 basis points of IPM share over five years per HSIE Research).
Geographic Spread: West Leads, Extra Urban Lags
IQVIA’s Q2 2025 report showed the West zone as the highest growing at 11%, driven by Maharashtra and Gujarat. The North zone leads in contribution, with Uttar Pradesh, Delhi, and Rajasthan adding the most incremental sales. Metros held 35% of IPM share and grew 11%, while extra-urban areas grew only 6%. This matters for field force deployment: companies with stronger metro and Tier-1 coverage (like Sun, Abbott, Cipla) are capturing disproportionate growth compared to those weighted toward smaller towns.
Indian versus MNC: The 83 to 17 Split
Indian companies hold 83% of IPM market share versus 17% for MNCs, per IQVIA Q2 2025. Among Indian companies, Sun, Intas, Torrent, Dr Reddy’s, and Glenmark grew in double digits in Q2 2025. Among MNCs, P and G, Janssen, Merck, Nutricia, and Mylan grew in double digits. The MNC presence in this ranking (Abbott India at rank 19, GSK at rank 29, Sanofi at rank 37) reflects legacy portfolio strength rather than aggressive expansion. Several MNCs are in decline: GSK lost 46 bps of value share over five years, and Abbott lost 16 bps, per HSIE Research.
Strategic Moves Reshaping the List

Consolidation: Torrent and JB Chemical
The most significant domestic consolidation move in 2025 is Torrent Pharmaceuticals’ agreement to acquire a controlling stake in JB Chemical and Pharma from KKR, at an equity valuation of approximately ₹2,560 crore, per JB Pharma’s BSE filing dated July 2025. JB Chemical is ranked 22 in IPM with 1.2% MAT share and is among the fastest-growing top-25 players. If completed, this would consolidate Torrent’s position in cardiac and GI therapies and push it closer to the top 10 by domestic formulation share.
Portfolio In-Licensing: Emcure and Sanofi
Emcure Pharma struck a distribution and promotion deal with Sanofi for leading cardiovascular brands in India, including Cardace, Clexane, Targocid, Lasix, and Lasilactone, per Emcure’s FY25 annual report. Emcure’s domestic revenue grew 16.4% year-on-year to ₹3,660 crore. This deal model, where an Indian company takes over commercialization of an MNC’s India portfolio, is a structural shift. Sanofi’s IPM share has been declining, and outsourcing field force to a domestic player with stronger reach is a rational response. Expect more MNC-to-domestic portfolio transfers.
Acquisition-Driven Growth: Mankind and BSV
Mankind Pharma acquired Bharat Serums and Vaccines (BSV) in 2024, expanding into complex super-specialty and women’s health therapies, per Mankind’s FY25 annual report. Mankind’s domestic revenue grew 13% to ₹10,675 crore, and it holds 4.8% IPM market share by value (rank 4) and 6.0% by volume (rank 2). The BSV acquisition moves Mankind from a pure acute and OTC model into specialty biologics, a significant strategy shift for a company built on mass-market penetration.
Patent Cliffs and GLP-1 Disruption
Two events in March 2025 reshaped the diabetes and obesity therapy landscape. Empagliflozin went off patent, opening the door for Indian generic launches. Eli Lilly launched Mounjaro (tirzepatide) in India, the first GLP-1 receptor agonist for obesity available domestically. IQVIA’s H1 2025 report listed Mounjaro among the top five new launches by value. For generics companies with diabetes franchises (USV, Sun, Mankind, Dr Reddy’s), the empagliflozin cliff is an opportunity. For the broader IPM, GLP-1 drugs could shift growth from traditional OAD molecules toward a new therapy class.
Regulatory Context: UCPMP 2024 and DPCO
The Department of Pharmaceuticals released the Uniform Code of Pharmaceutical Marketing Practices (UCPMP) 2024 as a voluntary code governing interactions between pharma companies and healthcare professionals. The current text is available on the Department of Pharmaceuticals website. Separately, the Drugs (Prices Control) Order, administered by the National Pharmaceutical Pricing Authority (NPPA), sets ceiling prices for scheduled formulations listed under the National List of Essential Medicines. These two frameworks shape how companies in this ranking can price and promote their products. For the precise provisions and the current NLEM list, refer to the NPPA and DoP official portals, as provisions are updated periodically.
Next Steps
This ranking is a starting point, not a finished dataset. The honest gaps are in ranks 35 to 50, where private companies do not disclose audited revenue and the IQVIA domestic audit only captures the covered retail market. If you are benchmarking competitors, three actions will sharpen your analysis:
- Subscribe to IQVIA or Pharmarack AWACS for monthly MAT tracking of domestic formulation share. This is how companies measure their own rank movement between annual report cycles.
- Separate domestic formulation revenue from total revenue when comparing API or CDMO-heavy companies like Divi’s, Granules, and Syngene against pure domestic formulation players like Mankind, USV, and Aristo.
- Track the consolidation pipeline. The Torrent-JB Chemical deal, the Emcure-Sanofi model, and the Mankind-BSV acquisition suggest that mid-cap consolidation will reshape ranks 10 to 25 over the next 18 months.
For strategy teams expanding beyond India, our analysis of pharma sales in pharmerging markets covers why a one-size sales force model fails when you take Indian generics into new geographies. If you want the underlying dataset behind this ranking, or if your company should be listed in ranks 35 to 50 with verified figures, reach out at connect@pharmarketin.com. We will update this ranking as new annual reports and rating agency rationales become available.
Frequently Asked Questions
What is the largest generic pharmaceutical company in India by revenue?
Sun Pharmaceutical Industries, with FY25 reported revenue of ₹52,041 crore per its audited annual report. Dr Reddy’s Labs (₹31,632 crore) and Aurobindo Pharma (₹31,378 crore) follow.
How is this ranking of Indian generic pharma companies compiled?
By total reported FY25 revenue from audited annual reports for listed companies, rating agency rationales and MCA filings for private companies, and IQVIA domestic IPM MAT ranking for companies that do not disclose total revenue. Each figure is labeled by source in the Basis column.
Which major Indian generic companies are private and do not disclose revenue?
Intas, Macleods, Aristo, USV, Micro Labs, and Hetero are private. Their figures here come from credit rating agencies like CRISIL and CARE, or MCA filings, and are marked as estimates. They should be treated as directional, not precise.
What drove Indian pharma market growth in FY25?
Pharmarack reported 8.4% growth to over ₹2.25 lakh crore, driven mainly by chronic therapies: cardiac at 10.8%, gastrointestinal at 10.2%, and anti-diabetic at 8%. Unit growth was only 1.2%, meaning most growth was price-driven.
How does IQVIA domestic MAT ranking differ from total revenue ranking?
IQVIA captures domestic retail formulation sales in the audited market only. Total revenue includes exports, API sales, and contract manufacturing. Companies like Divi’s Labs and Granules rank high by total revenue but have minimal domestic formulation presence.




Leave feedback about this