


Pharma Field Force Effectiveness Metrics: 12 to Track, 5 to
Your pharma field force effectiveness metrics should answer one question: is every rupee spent on the field force generating defensible prescription share? Most Indian pharma dashboards fail this test. They track call counts that get inflated, coverage percentages that measure visits instead of engagement, and Rx data that arrives 60 to 90 days after the field activity it is supposed to measure. The result is a review meeting where nobody can connect what the field force did last quarter to what the market actually did.
The Indian pharmaceutical market reached ₹2.46 lakh crore in FY26 with 8.8% growth, per Pharmarack data reported by Financial Express. On IQVIA’s rolling MAT basis, the market stood at ₹2,71,284 crore as of August 2026, growing 12.3% year-on-year (per ICICI Direct citing IQVIA). For a deeper breakdown of these figures and their methodology, see our Indian Pharmaceutical Market 2026 size and growth analysis. That market context sets the stakes: the IPM is growing, but growth is uneven across therapies, geographies, and company types. Your field force metrics need to tell you whether you are capturing your share of that growth or losing it.
This article gives you a shortlist of 12 metrics that actually drive field productivity, realistic target ranges for Indian field conditions, the measurement pitfalls that distort each one, and five metrics you should stop tracking because they consume review time without producing decisions.
The 12 Metrics That Matter (and the 5 to Ignore)

The 12 metrics below are organized into four categories: reach (are you getting to the right doctors?), quality (are those interactions productive?), efficiency (are you spending field force budget wisely?), and outcome (is the field force actually moving prescriptions?). Each metric has a specific data source, a realistic Indian target range (where public data exists), and a gaming risk that you need to account for in your review process.
No publicly available, verified benchmark exists for most of these target ranges across Indian pharma companies as a whole. The ranges cited below come from publicly reported IQVIA and Pharmarack data where available, and from the structure of Indian field force economics. Where no public figure exists, we say so and explain how a company would measure it internally.
| # | Metric | Category | What It Measures | Data Source | Realistic Indian Target | Gaming Risk |
|---|---|---|---|---|---|---|
| 1 | Doctor coverage rate (weighted) | Reach | Percentage of targeted HCPs visited at planned frequency, weighted by prescription value tier | CRM | Company-specific; no public benchmark | Counting any visit as coverage regardless of call quality |
| 2 | Call frequency per HCP tier | Reach | Number of visits per HCP per month, segmented by prescribing tier | CRM | Company-specific; tier by IQVIA/Pharmarack Rx data | Clustering visits at month-end to hit frequency targets |
| 3 | Productive call rate | Quality | Percentage of calls where the HCP was met, the brand was detailed, and a specific ask was made | CRM + manager observation | Company-specific; measure internally via call rubric | Defining “productive” so loosely that any signature counts |
| 4 | Call quality score (rubric-based) | Quality | Structured score on observed calls: opening, probing, detailing accuracy, objection handling, closing | Manager observation or call recording | No public benchmark; set by scoring current top performers | Manager inflation to protect team ratings |
| 5 | Detailing adherence rate | Quality | Percentage of calls where the MR presented the correct MLR-approved content module for that HCP segment | CRM content usage logs | Company-specific | MRs logging a module as presented without actually showing it |
| 6 | CRM sync rate (24-hour) | Efficiency | Percentage of field engagements visible in the MR dashboard within 24 hours | CRM analytics | Company-specific; target 90%+ | Batch-uploading calls at day end with fabricated timestamps |
| 7 | Digital channel adoption rate | Efficiency | Percentage of MRs actively using e-detailing and approved WhatsApp follow-up | Platform usage analytics | Company-specific | Counting login as adoption, not actual content delivery |
| 8 | Cost per productive call | Efficiency | Fully loaded field force cost divided by productive calls per month | Finance + CRM | No public benchmark; calculate internally | Understating fully loaded cost by excluding travel, samples, manager overhead |
| 9 | Brand Rx share (test vs. control geography) | Outcome | Prescription share movement in territories with focused field activity versus control territories | IQVIA or Pharmarack audit data | Measure delta over 2+ quarters | Selecting favorable control territories to manufacture a positive delta |
| 10 | Rx share growth vs. therapy MAT growth | Outcome | Whether your brand is gaining or losing share relative to its therapy area’s overall growth rate | IQVIA or Pharmarack | Therapy-specific; per IQVIA/Pharmarack therapy data | Comparing against the wrong therapy basket or time window |
| 11 | MR attrition rate (12-month) | Efficiency | Percentage of onboarded MRs who exit within 12 months | HRIS / payroll | No verified public figure; industry estimates 20-30% | Excluding involuntary exits to keep the rate low |
| 12 | Time to first productive call | Quality | Days from onboarding start to first call quality score meeting certification threshold | CRM + manager scoring | No public benchmark; measure per cohort | Setting the certification threshold so low that it is meaningless |
5 Metrics to Stop Tracking
These five metrics appear on most Indian pharma SFE dashboards but produce no decisions. They consume review time, create gaming incentives, and crowd out the metrics that matter.
| Metric to Drop | Why It Fails | What to Track Instead |
|---|---|---|
| Raw daily call count | Inflated through phantom calls, signatures without detailing, and end-of-month batch logging. The number tells you nothing about call quality or prescription impact. | Productive call rate (#3) and call quality score (#4) |
| Total doctor coverage (unweighted) | Counts every doctor visited equally, whether they prescribe 500 units a month or 5. A 90% coverage rate that is concentrated in low-value HCPs is worse than 60% coverage focused on high-value prescribers. | Weighted doctor coverage rate (#1) |
| Samples distributed per call | Encourages sample-dumping as a proxy for engagement. An HCP receiving samples is not the same as an HCP being detailed. This metric creates a logistical incentive without a sales link. | Detailing adherence rate (#5) |
| Number of CME events attended by HCPs | Counts attendance, not engagement or prescription change. An HCP who signs in and leaves produces the same metric as one who stays for the full session and asks questions. | HCP engagement rate by channel (from your omnichannel framework) |
| Monthly expense variance vs. budget | A finance metric, not an SFE metric. Expense variance tells you whether the MR stayed within travel allowance, not whether the calls produced prescriptions. It belongs in a finance review, not a field force effectiveness review. | Cost per productive call (#8) |
Target Ranges for Indian Field Realities
Target ranges for pharma field force effectiveness metrics in India cannot be copy-pasted from Western benchmarks. Indian field economics differ on three axes: territory density (metro versus upcountry), call cost (Tier-1 versus Tier-2), and attrition pressure. Setting the same target for a Mumbai cardiac rep and a Tier-3 anti-infective rep guarantees that one of them is being measured against the wrong standard.
Metro vs. Upcountry Doctor Coverage
IQVIA’s Q2 2025 data showed metros growing at 11% and Class 1 cities at 9%, while extra-urban markets grew at just 6% (per IQVIA’s Q2 2025 quarterly insights). That growth divergence shapes how you should set coverage targets. In a metro territory, HCP density is high, travel time between clinics is short, and a rep can physically reach 8 to 10 doctors per day. In a Tier-3 district, travel time can consume 40% of the working day, and the same rep might reach 4 to 5 doctors.
No publicly available benchmark exists for doctor coverage rates by territory type in Indian pharma. A company would measure this internally by calculating the percentage of targeted HCPs in each territory who received the planned call frequency for their tier, then segmenting by metro, Class 1, and extra-urban territories. If your metro coverage target is 85% but your upcountry target is 70% because of travel constraints, that is a defensible range. Forcing the same 85% across both is not.
Tier-1 vs. Tier-2 Call Costs
No publicly available, verified figure exists for the per-call cost of an Indian pharma MR, segmented by territory tier. This is one of the most important numbers in SFE, and almost nobody publishes it. A company would calculate it internally by dividing the fully loaded monthly field force cost for a territory (MR salary, travel allowance, sample cost, manager overhead allocation, CRM and digital tool cost) by the number of productive calls in that month.
The structural reality is that a Tier-1 metro call costs more in salary and allowances but less in travel time per call, while a Tier-2 call costs less in salary but more in travel. The tradeoff means that cost per productive call can be comparable across tiers if productivity is measured correctly, but only if you are counting productive calls, not raw visits. A Tier-2 rep making 5 productive calls per day at lower salary cost may have a better cost per productive call than a Tier-1 rep making 8 raw calls where only 4 are productive.
MR Attrition and Its Metric Impact

No publicly available, verified figure exists for the annual MR attrition rate across Indian pharma companies as a whole. Industry practitioners commonly cite estimates of 20% to 30% depending on company size and therapy area, but these are not audited statistics. Attrition directly distorts every metric on this dashboard. A 25% annual attrition rate means a quarter of your field force is in onboarding at any given time, and their call quality scores, coverage rates, and CRM sync rates will be lower than experienced MRs. If you do not segment metrics by tenure cohort, your aggregate dashboard is blending new-hire underperformance with veteran productivity and producing a misleading average.
Measure attrition internally: calculate the percentage of MRs who exit within 12 months of onboarding completion, segmented by therapy area, territory type, and reporting manager. Then segment your SFE metrics by the same cohorts. The question is not whether your overall call quality score is 72 out of 100. The question is whether your 12-month-plus MRs score 80 while your under-6-month MRs score 55, and whether the gap is closing as onboarding improves.
For a structured framework on reducing attrition through better onboarding and refresher training, see our medical representative training program and our analysis of maximizing field force effectiveness through strategic refresher training. Both connect training investment to the attrition metrics that drag your SFE dashboard down.
Where Measurement Goes Wrong: Gaming and Data Lags
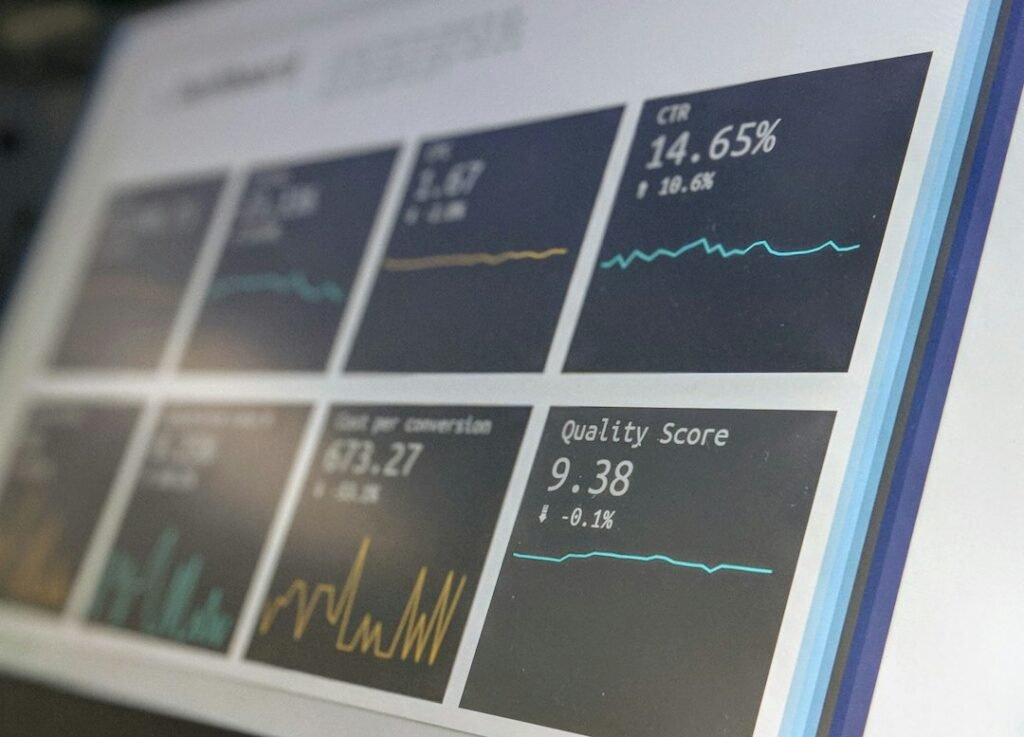
Every metric on your dashboard can be gamed. The question is not whether your field force games metrics, but whether you have built controls to detect it. Three measurement failures dominate Indian pharma SFE: inflated call counts, survey-based coverage that measures activity instead of engagement, and Rx data lags that decouple field activity from prescription outcomes.
Inflated Call Counts and Phantom Visits
Raw call counts are the most gamed metric in Indian pharma SFE. The mechanics are simple: an MR logs a call because they were in the clinic vicinity, not because they met the doctor. Or they log a call based on a chemist interaction and count it as a doctor visit. Or they batch-log calls at the end of the month to hit targets, with timestamps that do not match actual field movement. The result is a call count that looks healthy while productive engagement is declining.
The control is to replace raw call counts with productive call rate (metric #3), defined as a call where the HCP was met, the brand was detailed, and a specific ask was made. Verify a sample of calls through manager field rides and CRM timestamp audits. If 20% of logged calls have timestamps outside clinic hours or clustered on the last two days of the month, you have a gaming problem. The fix is not better enforcement of call counts. It is replacing the metric with one that is harder to game and more predictive of prescription outcomes.
Survey-Based Coverage Versus Actual Engagement
Many Indian pharma companies measure coverage through self-reported MR surveys: did you visit Doctor X this month? The MR says yes. The survey says coverage is 90%. But a visit is not an engagement. The doctor may have been unavailable, the call may have lasted 90 seconds, or the MR may have left a sample at the reception without detailing. Survey-based coverage measures intent, not outcome.
Replace survey-based coverage with CRM-logged, weighted coverage (metric #1) that segments HCPs by prescription value tier and tracks whether the planned frequency for each tier was achieved. Cross-check with manager field observations. If your CRM shows 90% coverage but your field managers report that 30% of calls in their ride-alongs were non-productive, your coverage rate is overstated by roughly 27 percentage points.
Rx Data Lags in AWACS and IQVIA
The most structural measurement problem in Indian pharma SFE is the lag between field activity and prescription data. Pharmarack (formerly AIOCD-AWACS) and IQVIA both track retail chemist sales, but their data arrives with a time lag. Pharmarack’s monthly data typically appears with a 4 to 6 week lag, while IQVIA’s audit data can lag 6 to 8 weeks depending on the subscription tier. This means that in your monthly review, you are comparing field force activity from this month against Rx data from two months ago.
The lag creates a false narrative. Your field force had a great month, but Rx data shows flat or declining share because it is measuring the previous period’s activity. Or worse: your field force had a bad month, but Rx data shows share growth because of strong activity from two months ago that is only now appearing in the audit. Review meetings that compare this month’s calls to this month’s Rx data are comparing two different time periods without realizing it.
The fix is to align your review cadence to the data lag. When Rx data arrives, compare it to the field activity from the corresponding period, not the current period. Track field metrics on a rolling 3-month basis so that the most recent month’s Rx data aligns with the field activity from two months prior. This is not a sophisticated analytics problem. It is a basic data hygiene discipline that most Indian pharma review meetings get wrong because the default is to compare everything to the current month.
A Basic SFE Dashboard, Explained
A functional SFE dashboard for an Indian pharma field force does not need 50 metrics. It needs 12, organized in a way that tells a causal story from reach to outcome. Here is how to structure it.
Layer 1: Reach (Weekly Review)
Track weighted doctor coverage rate (#1) and call frequency per HCP tier (#2) weekly. These are leading indicators: if coverage drops this week, Rx share will drop in 8 to 12 weeks. Review by territory type (metro, Class 1, extra-urban) so that coverage targets reflect field realities. Flag any territory where coverage drops more than 10 percentage points week-over-week for manager investigation.
Layer 2: Quality (Monthly Review)
Track productive call rate (#3), call quality score (#4), and detailing adherence rate (#5) monthly. Segment by MR tenure cohort (under 6 months, 6 to 12 months, 12 months plus) so that new-hire underperformance does not distort the aggregate. The call quality score should come from manager field observations on a structured rubric, not from self-reporting. For the rubric design and scoring methodology, see our 6-stage MR onboarding framework, which includes the certification rubric used at the end of onboarding.
Layer 3: Efficiency (Monthly Review)
Track CRM sync rate (#6), digital channel adoption rate (#7), cost per productive call (#8), and MR attrition rate (#11) monthly. CRM sync rate is your canary: if it drops below 90%, your dashboard data is unreliable and every other metric derived from it is suspect. Cost per productive call should be segmented by territory tier so that you can see whether your Tier-2 field force is genuinely more cost-efficient or just logging fewer calls. For a broader framework on how digital adoption intersects with field force effectiveness, see our omnichannel HCP engagement framework.
Layer 4: Outcome (Quarterly Review)
Track brand Rx share in test versus control geographies (#9) and Rx share growth versus therapy MAT growth (#10) quarterly, aligned to the Rx data lag. Use IQVIA or Pharmarack therapy-level data as your benchmark. For the therapy-level context, our IPM 2026 analysis includes the therapy-level MAT growth table from both providers. Compare your brand’s MAT growth against the therapy growth rate, not against the overall IPM average. A brand growing at 8% in a therapy growing at 14% is losing share, even though 8% looks positive on an absolute basis.
Time to first productive call (#12) is reviewed per onboarding cohort, not on a fixed cadence. It tells you whether your onboarding program is producing field-ready MRs faster or slower over time. If your average time to first productive call is stretching from 10 weeks to 14 weeks across cohorts, your onboarding curriculum needs attention before it shows up as a coverage and quality gap three months later.
If you are a sales leader rebuilding your SFE dashboard, start with a baseline audit of your current metrics: which ones are gamed, which ones have data lag issues, and which ones your review meeting actually acts on. Then replace the noise metrics with the 12 above, segment by territory type and tenure cohort, and align your Rx outcome review to the data lag. Reach out at connect@pharmarketin.com for a practitioner-level conversation about scoping this for your field force size, therapy areas, and territory configuration. We at Pharmarketin.com are always up for a grounded discussion, and we can help you pressure-test your SFE dashboard design, gaming controls, or metric segmentation against the latest IQVIA and Pharmarack data.
Frequently Asked Questions
What are the most important pharma field force effectiveness metrics to track?
The 12 metrics that matter fall into four categories: reach (weighted doctor coverage rate, call frequency per HCP tier), quality (productive call rate, call quality score, detailing adherence rate, time to first productive call), efficiency (CRM sync rate, digital channel adoption rate, cost per productive call, MR attrition rate), and outcome (brand Rx share in test vs. control geographies, Rx share growth vs. therapy MAT growth). Each metric should be segmented by territory type and MR tenure cohort.
How do you prevent inflated call counts in pharma SFE dashboards?
Replace raw call counts with productive call rate, defined as a call where the HCP was met, the brand was detailed, and a specific ask was made. Verify a sample of calls through manager field rides and CRM timestamp audits. If a significant percentage of logged calls have timestamps outside clinic hours or clustered on the last two days of the month, you have a gaming problem that requires metric redesign, not enforcement.
How does Rx data lag affect pharma field force measurement in India?
Pharmarack (formerly AIOCD-AWACS) data typically arrives with a 4 to 6 week lag, while IQVIA audit data can lag 6 to 8 weeks. This means review meetings comparing this month’s field activity to this month’s Rx data are comparing two different time periods. The fix is to align your review cadence to the data lag: when Rx data arrives, compare it to field activity from the corresponding period, not the current period.
What is a good MR attrition rate benchmark for Indian pharma companies?
No publicly available, verified figure exists for the annual MR attrition rate across Indian pharma companies as a whole. Industry practitioners commonly cite estimates of 20% to 30%, but these are not audited statistics. A company should measure attrition internally by calculating the percentage of MRs who exit within 12 months of onboarding completion, segmented by therapy area, territory type, and reporting manager.
Which SFE metrics should Indian pharma companies stop tracking?
Five metrics to drop: raw daily call count (inflated through phantom calls), unweighted total doctor coverage (treats all doctors equally regardless of prescription value), samples distributed per call (encourages sample-dumping as a proxy for engagement), number of CME events attended (counts attendance not engagement), and monthly expense variance vs. budget (a finance metric, not an SFE metric). Replace each with the corresponding metric from the 12-metric framework.






Leave feedback about this