

Indian Pharmaceutical Market 2026: Size, Growth, Structure
The Indian pharmaceutical market reached ₹2.46 lakh crore in FY26 (April 2025 to March 2026) with 8.8% growth, per Pharmarack data reported by Financial Express. On IQVIA’s rolling MAT basis, the market stood at ₹2,71,284 crore as of August 2026, growing 12.3% year-on-year (per ICICI Direct citing IQVIA). For pharma strategy leaders, those two numbers frame the structural reality: the IPM is growing steadily, but the growth is not evenly distributed across therapies, company types, or pricing segments. This page is the hub for understanding that distribution.
For a plain-English explainer on what IPM means and how it is measured, see our guide on what IPM in pharma is. MAT stands for Moving Annual Total, the cumulative value of pharmaceutical sales over the immediately preceding 12 months, recalculated every month as the oldest month drops off and the newest is added. It is the standard benchmark the industry uses to smooth seasonal noise and track true growth.
India’s Pharma Market: The 2026 Numbers First
Two data providers dominate IPM measurement: IQVIA (through its Total Sales Audit) and Pharmarack (formerly AIOCD-AWACS, through its PharmaTrac product). Both track retail chemist sales across India, but their methodologies and sample coverage differ, producing headline numbers that can vary by ₹20,000 to ₹25,000 crore. That gap is not a disagreement about market direction. It is a function of different stockist panels, projection models, and coverage of the long tail of Class 4 and rural chemists.
The table below presents the most recent publicly reported figures from both sources, with the period, metric, and sourcing clearly identified. Anyone using this data for competitive benchmarking should note which provider the number comes from before comparing across sources.
| Period | Market Size | Growth | Source |
|---|---|---|---|
| FY26 (Apr 2025 to Mar 2026) | ₹2.46 lakh crore | 8.8% | Pharmarack via Financial Express |
| FY25 (Apr 2024 to Mar 2025) | ₹2.25 lakh crore | 8.4% | Pharmarack via Business Standard |
| MAT Aug 2026 (Sep 25 to Aug 26) | ₹2,71,284 crore | 12.3% | IQVIA via ICICI Direct |
| MAT Jun 2026 (Jul 25 to Jun 26) | ₹2,64,900 crore | ~11.1% | IQVIA via ICICI Direct |
| MAT May 2026 (Jun 25 to May 26) | ₹2,61,691 crore | 10.7% | IQVIA via ICICI Direct |
| MAT Apr 2026 (May 25 to Apr 26) | ₹2,59,176 crore | 10.3% | IQVIA via LinkedIn |
| MAT Mar 2026 (Apr 25 to Mar 26) | ₹2,45,943 crore | 8.6% | Pharmarack via Medical Dialogues |
| Q2 2025 (Apr to Jun 2025) | ₹61,000 crore | 9% over Q2 2024 | IQVIA Q2 2025 report |
Three caveats matter for anyone using this table. First, Pharmarack’s FY26 figure is a fiscal-year aggregate (April to March), while IQVIA’s MAT figures are rolling 12-month windows that end in different months. They are not directly comparable period-to-period. Second, the gap between the two providers has widened in 2026: IQVIA’s MAT Aug 2026 at ₹2,71,284 crore is approximately ₹25,000 crore higher than Pharmarack’s MAT Mar 2026 at ₹2,45,943 crore, partly because IQVIA’s MAT captures more recent months when monthly growth has accelerated (13% in August 2026 alone). Third, neither figure captures hospital procurement, government tenders, or Janaushadhi store sales. IPM is the retail prescription channel only.
Growth Decomposition: Price, Volume, and New Products
The headline growth rate is the sum of three levers: price growth (driven by DPCO annual WPI revisions and brand-level pricing), new product introductions (NPI), and volume growth (units sold). Tracking these three separately tells you whether growth is sustainable or just a price hike riding through.
As of IQVIA MAT May 2026, the decomposition was: price growth contributed approximately 4.5 percentage points, NPI contributed approximately 3 percentage points, and volume growth contributed 3.2 percentage points to the total 10.7% MAT growth (per Equirus Securities analysis citing IQVIA data). The volume contribution is the notable shift: it was just 0.8 percentage points a year earlier. Volume is recovering, which means more patients are being reached, not just paying higher prices.
Pharmarack’s FY26 data tells a more cautious story on the same metric. Sheetal Sapale, Vice President (Commercial) at Pharmarack, noted that 8.6% of the 8.8% FY26 growth came from value expansion, with just 0.6% contribution from unit sales (per Financial Express). The gap between IQVIA and Pharmarack on volume contribution is another reminder that the two providers measure slightly different slices of the market.
Chronic vs Acute: The Split That Shapes Strategy

Chronic therapies have outpaced acute therapies in IPM growth for several consecutive years, and the gap is widening. As of IQVIA MAT June 2026, chronic therapies grew at 15.2% while acute therapies grew at 8.5% (per MOFSL analysis citing IQVIA data). Acute therapies still hold the larger share of the market at 59.3% of IPM, but chronic is where the growth momentum and the strategic investment are concentrated.
| Metric | Chronic | Acute | Source |
|---|---|---|---|
| Monthly growth (Aug 2026) | 16% | 11% | IQVIA via ICICI Direct |
| Monthly growth (Jun 2026) | 20% | 13% | IQVIA via ICICI Direct |
| Monthly growth (May 2026) | 15% | 10% | IQVIA via ICICI Direct |
| MAT growth (Jun 2026) | 15.2% | 8.5% | IQVIA via MOFSL |
| Share of IPM (MAT Jun 2026) | ~40.7% | 59.3% | IQVIA via MOFSL |
| MAT growth (Q2 2025) | 10% | 7% | IQVIA Q2 2025 report |
The structural driver behind this divergence is India’s shifting disease burden. Cardiac, anti-diabetic, and neuro/CNS therapies require long-term, repeat prescriptions that build a compounding revenue base. Acute therapies like anti-infectives are episodic, seasonal, and increasingly constrained by antibiotic stewardship norms. For brand managers, this split directly shapes where companies are deploying field force, launching new brands, and investing in patient adherence programs.
Therapy-Level Breakdown (Pharmarack MAT March 2026)
The table below shows therapy-level performance from Pharmarack’s MAT March 2026 data (per Medical Dialogues, citing Pharmarack). This is the most granular publicly available therapy-level snapshot for the fiscal year that just closed.
| Therapy | MAT Value (₹ Cr) | Share (%) | Value Growth (%) | Unit Growth (%) |
|---|---|---|---|---|
| Cardiac | 34,297 | 14% | 14.0% | 5.3% |
| Gastrointestinal | 28,894 | 12% | 4.1% | -4.9% |
| Anti-Infectives | 27,821 | 11% | 5.4% | -1.6% |
| Anti-Diabetic | 23,051 | 9% | 11.3% | 2.8% |
| Vit/Min/Nut | 21,845 | 9% | 6.9% | -0.6% |
| Respiratory | 19,270 | 8% | 11.2% | 7.9% |
| Pain/Analgesics | 16,757 | 7% | 6.5% | -2.2% |
| Neuro/CNS | 16,580 | 7% | 10.1% | 0.9% |
| Derma | 15,923 | 6% | 7.5% | -0.7% |
| Gynaecological | 7,781 | 3% | 7.6% | 1.3% |
| Vaccines | 2,434 | 1% | 20.1% | 11.5% |
| Urology | 4,424 | 2% | 15.2% | 6.3% |
Two patterns stand out. Cardiac at 14% value growth and 5.3% unit growth is the market’s structural anchor: it is the largest therapy by value (₹34,297 crore MAT) and is growing well above the IPM average on both value and volume. Anti-infectives, the third-largest therapy, grew only 5.4% on value and contracted 1.6% on units, dragging down the acute aggregate. Gastrointestinal, the second-largest therapy, saw value growth of just 4.1% with a 4.9% unit decline, which is a signal worth investigating for any brand team operating in that segment.
The GLP-1 Disruption Within Anti-Diabetic
Within the anti-diabetic segment (₹23,051 crore MAT, 11.3% growth), the GLP-1 agonist sub-segment has reshaped the competitive landscape in under two years. As of Pharmarack MAT March 2026, the GLP-1 agonist market reached approximately ₹1,600 crore, up from ₹527 crore a year earlier (per Medical Dialogues, citing Pharmarack). Tirzepatide alone accounted for ₹988 crore of that, following the launch of Mounjaro in India in early 2025. Semaglutide stood at ₹474 crore, supported by branded generic launches after patent expiry.
Separately, empagliflozin’s patent loss in March 2025 triggered an 85% price drop from ₹60-70 per tablet to ₹5-15 per tablet, with 86 brands from 19 companies entering the molecule within the first month (per Business Standard citing Pharmarack). For strategy teams, the GLP-1 and SGLT-2 disruptions are the clearest examples of how patent cliffs and innovation launches can compress or expand a therapy segment’s value within a single fiscal year.
MNCs vs Domestic Firms: The Share Battle

Indian companies hold 84% of the Indian pharmaceutical market and MNCs hold 16%, as of IQVIA MAT June 2026 (per MOFSL citing IQVIA). But the growth differential is shifting: MNCs grew at 19% in June 2026 versus 16% for Indian companies on a monthly basis, and 13.7% versus 10.2% on a MAT May 2026 basis (per Financial Express citing IQVIA). This marks the second consecutive year of MNC share gain, reversing a decade-long decline from 22% in 2013 to below 16% in 2024.
The MNC resurgence is driven by three forces: GLP-1 blockbuster launches (Mounjaro, Wegovy, Ozempic), specialty and oncology portfolios, and strong chronic care franchises. The growth gap is most pronounced in the chronic segment, where MNCs are leveraging premium pricing and breakthrough innovations. Indian companies continue to dominate on absolute volume and market share, but the growth narrative is tilting toward MNCs for the first time in over a decade. For a deeper look at how MNCs and domestic firms differ in digital marketing adoption, see our MNC vs domestic digital adoption study.
Top Companies by MAT (IQVIA MAT June 2026)
The table below ranks the top companies by MAT value, market share, and growth, using IQVIA data as reported by MOFSL. For a more comprehensive ranking of Indian generic companies, see our top 50 generic pharmaceutical companies in India.
| Company | MAT Value (₹ bn) | Market Share (%) | MAT Growth (%) | Type |
|---|---|---|---|---|
| Sun Pharma | 214 | 8.1% | 12.7% | Indian |
| Abbott | 167 | 6.3% | 8.9% | MNC |
| Cipla | 149 | 5.6% | 10.6% | Indian |
| Mankind | 125 | 4.7% | 9.0% | Indian |
| Torrent | 123 | 4.7% | 11.9% | Indian |
| Alkem | 103 | 3.9% | 10.0% | Indian |
| Intas | 101 | 3.8% | 15.8% | Indian |
| Lupin | 92 | 3.5% | 13.0% | Indian |
| Macleods | 87 | 3.3% | 11.5% | Indian |
| Dr. Reddys | 85 | 3.2% | 13.5% | Indian |
| Zydus | 76 | 2.9% | 11.7% | Indian |
| Glenmark | 59 | 2.2% | 14.6% | Indian |
| GSK | 57 | 2.2% | 8.5% | MNC |
| Emcure | 58 | 2.2% | 4.6% | Indian |
| Ipca | 55 | 2.1% | 11.7% | Indian |
Intas at 15.8% MAT growth is the fastest-growing large Indian company, driven by its chronic portfolio. Glenmark at 14.6% and Dr. Reddys at 13.5% also outpaced the IPM average of 11.1%. Among MNCs, Abbott’s 8.9% growth underperforms the market despite its large base, partly because its portfolio is more acute-weighted. GSK at 8.5% continues to rely heavily on Augmentin (₹816 crore in FY25, the top-selling brand by value per Pharmarack), which exposes it to anti-infective headwinds. Emcure at 4.6% is the slowest-growing company in this list, reflecting portfolio mix challenges.
DPCO, Janaushadhi, and the Pricing Layer
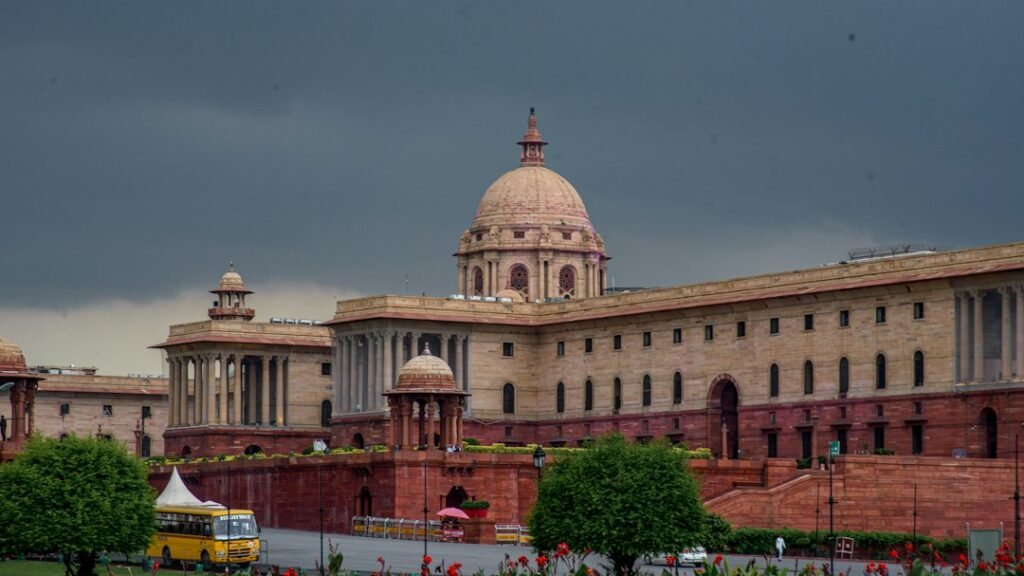
The pricing layer of the Indian pharmaceutical market is governed by three mechanisms that every strategy leader needs to understand: the Drugs (Prices Control) Order 2013 administered by the National Pharmaceutical Pricing Authority (NPPA), the Pradhan Mantri Bhartiya Janaushadhi Pariyojana (PMBJP) generic store network, and the Uniform Code for Pharmaceutical Marketing Practices (UCPMP) 2024 governing promotional conduct. Together, these set the ceiling on what you can charge, the floor of competitive pricing pressure from government generics, and the rules for how you can promote.
DPCO 2013 and NPPA Ceiling Prices
The Drugs (Prices Control) Order 2013 caps the ceiling prices of scheduled formulations listed in the National List of Essential Medicines (NLEM) 2022. As of March 25, 2025, NPPA had fixed ceiling prices for 928 scheduled formulations (per PIB, March 2025). NPPA has also notified approximately 3,200 retail prices for new drugs under DPCO 2013.
Ceiling prices are revised annually based on the Wholesale Price Index (WPI) for all commodities. The revision for FY2025-26 (effective April 1, 2025) was 1.74028%, based on calendar year 2024 WPI data (per NPPA, as reported by industry publications). NPPA revised ceiling prices for 748 scheduled formulations under NLEM 2022 and 152 under NLEM 2015 in that notification. For brand teams, the WPI revision sets the maximum annual price increase for scheduled formulations. If your brand is under DPCO, your pricing flexibility is capped at this WPI-linked ceiling, regardless of demand or competitive dynamics.
Janaushadhi: The Generic Store Network
The PMBJP scheme operates 20,149 Jan Aushadhi Kendras across India as of June 30, 2026, with a product basket of 2,110 medicines and 315 surgicals and consumables (per PIB, July 2026). Medicines under PMBJP are priced 50% to 80% cheaper than branded equivalents. Sales in FY2025-26 reached ₹2,252 crore in MRP value, and the government has set a target of 25,000 Kendras by March 2027. On average, 15 lakh people visit Jan Aushadhi Kendras daily.
For context, ₹2,252 crore in Janaushadhi sales represents less than 1% of the IPM’s ₹2.46 lakh crore. The competitive threat to branded generics is not yet at scale, but the trajectory matters: the Kendra count grew from 80 in 2014 to over 20,000 in 2026, and the product basket is expanding. For a consumer-perspective analysis of Janaushadhi medicines and patient trust, see our coverage of what Indian patients really say about generic medicines.
UCPMP 2024: The Marketing Conduct Code
The Uniform Code for Pharmaceutical Marketing Practices (UCPMP) 2024 was published by the Department of Pharmaceuticals on March 12, 2024, and subsequently amended on September 1, 2025 (per the Department of Pharmaceuticals). It is a mandatory code governing all promotional activities by pharmaceutical companies in India.
Key provisions as published: promotion must be consistent with the terms of a drug’s marketing approval. Brand reminders must not exceed ₹1,000 per item. The company CEO must submit a self-declaration of compliance within two months of every financial year end. Complaints are handled by Ethics Committees for Pharmaceutical Marketing Practices (ECPMP) at the association level, with appeal to the Apex Committee for Pharma Marketing Practices (ACPMP) at the Department of Pharmaceuticals. The September 2025 amendment simplified the marketing expenditure disclosure form and clarified the valuation method for free samples distributed to healthcare practitioners.
For brand managers, UCPMP 2024 and DPCO together define the guardrails within which every promotional campaign, HCP engagement program, and pricing decision must operate. An agency or internal team that cannot distinguish between UCPMP promotional conduct rules and DPCO price ceilings is a compliance risk. For a structured framework on evaluating pharma marketing partners within these guardrails, see our guide on evaluating a pharmaceutical digital marketing agency.
Growth Drivers to Watch Through 2026
Five structural forces are shaping the Indian pharmaceutical market’s trajectory through 2026 and into 2027. Strategy leaders tracking these will be better positioned to allocate field force, launch budgets, and portfolio investment.
1. Volume Recovery
Volume growth contributing 3.2 percentage points to IQVIA’s 10.7% MAT growth in May 2026, up from 0.8 percentage points a year earlier, is the most positive structural signal in the current data. For years, IPM growth was overwhelmingly price-driven. If volume sustains at 3-plus percentage points, it means prescription uptake is genuinely expanding, not just prices rising. Brand managers should track the volume contribution in their own therapy segments monthly to distinguish real prescription growth from price-led inflation.
2. GLP-1 and Metabolic Therapies
The GLP-1 agonist market crossed ₹1,600 crore MAT by March 2026, up from ₹527 crore a year earlier. Tirzepatide (Mounjaro) at ₹988 crore and semaglutide (Ozempic, Wegovy, and branded generics) at ₹474 crore are reshaping the anti-diabetic and anti-obesity segments. As Pharmarack noted, the rising adoption of GLP-1 therapies is expected to shift demand from conventional oral anti-diabetic drugs toward high-value, outcome-driven treatments. This also creates a secondary demand driver for VMN therapies, as appetite suppression increases the need for micronutrient supplementation.
3. Chronic Disease Burden Deepening
Cardiac therapies grew 14% on MAT March 2026 with 5.3% unit growth, the strongest volume performance among major therapies. Pharmarack attributed this to rising cardiovascular disease burden, increased screening, early diagnosis, and a shift toward comprehensive risk management including lipid-lowering agents, antiplatelet agents, and heart failure treatments. Anti-diabetic growth at 11.3% was driven by increased screening, improved disease monitoring, and combination therapy adoption. For companies with chronic-heavy portfolios, this is a structural tailwind. For acute-heavy portfolios, it is a headwind that requires portfolio rebalancing.
4. Patent Cliffs and Generic Entry Waves
Empagliflozin’s patent loss in March 2025 triggered an 85% price collapse and 86 brand entries within a month. Semaglutide’s patent expiry opened the door for branded generics that are now priced far below the innovator. These events demonstrate how quickly a molecule can shift from high-margin monopoly to commoditized competition. Strategy teams should map their portfolio’s patent cliff timeline and pre-position generic entry strategies, including pricing, field force allocation, and brand differentiation. For broader context on India’s pharma growth trajectory, see our analysis of five-year double-digit growth drivers.
5. Urban-Rural Growth Divergence
IQVIA data has consistently shown metros growing faster than Class 1 cities, which in turn grow faster than extra-urban markets. This was visible in Q2 2025 data where metros grew at 11% and Class 1 cities at 9%, while extra-urban markets grew at just 6% (per IQVIA’s Q2 2025 quarterly insights). For sales leaders, this divergence has direct implications for territory prioritization, MR deployment, and the urban-versus-rural split of promotional spend. The chronic-acute divergence compounds this: chronic therapies are more concentrated in metros where screening infrastructure and specialist access are better, while acute therapies have a broader geographic footprint.
Navigate the IPM Hub
This page is designed as the central reference for the Indian pharmaceutical market. Each section above connects to spoke topics that deserve deeper treatment. Use the links below to drill into specific areas:
- IPM fundamentals: What is IPM in pharma? covers the definition, measurement methodology, and how to read a MAT table.
- Company rankings: Top 50 generic pharmaceutical companies in India provides a deeper competitive landscape with sourcing methodology.
- MNC vs domestic digital adoption: Our 2025 study of 199 pharma professionals maps how MNCs and domestic firms differ in AI, SEO, and omnichannel capabilities.
- Generic medicines and patient trust: The truth about Janaushadhi medicines examines consumer perceptions of generic quality and savings.
- Marketing ROI: Analyzing marketing expense effectiveness connects IPM data to spend accountability.
- HCP engagement: Omnichannel HCP engagement framework connects field force strategy to market growth.
- Growth context: India’s five-year double-digit growth provides the longer-term trajectory behind the 2026 numbers.
If you want a practitioner-level conversation about how these market structures apply to your specific therapy area, portfolio, or field force configuration, reach out at connect@pharmarketin.com. We at Pharmarketin.com are always up for a grounded discussion, and we can help you pressure-test your market assumptions against the latest IQVIA and Pharmarack data. You can also subscribe to our newsletter for regular IPM trend breakdowns, therapy-level analysis, and digital adoption benchmarks.
Frequently Asked Questions
What is the size of the Indian pharmaceutical market in 2026?
Per Pharmarack, the domestic IPM reached ₹2.46 lakh crore in FY26 (April 2025 to March 2026) with 8.8% growth. IQVIA’s MAT August 2026 data puts the rolling 12-month market at ₹2,71,284 crore with 12.3% growth. The difference reflects different methodologies and sample coverage between the two data providers.
What is the chronic vs acute therapy split in the Indian pharmaceutical market?
As of IQVIA MAT June 2026, acute therapies held 59.3% of IPM share while chronic therapies held approximately 40.7%. Chronic therapies grew at 15.2% MAT versus 8.5% for acute therapies, driven by cardiac (14%), anti-diabetic (11.3%), and neuro/CNS (10.1%) segments.
How much market share do MNCs hold in the Indian pharmaceutical market?
As of IQVIA MAT June 2026, Indian companies held 84% of IPM market share and MNCs held 16%. MNCs have been gaining share since 2024, growing at 13.7% versus 10.2% for Indian companies on a MAT May 2026 basis, driven by GLP-1 launches like Mounjaro and Wegovy.
How does DPCO price control affect the Indian pharmaceutical market?
The Drugs (Prices Control) Order 2013, administered by NPPA, caps ceiling prices for scheduled formulations listed in NLEM 2022. As of March 2025, NPPA had fixed ceiling prices for 928 scheduled formulations. Ceiling prices are revised annually based on WPI; the FY2025-26 revision was 1.74% based on calendar year 2024 WPI data.
What is the Janaushadhi scheme’s impact on the pharmaceutical market?
As of June 30, 2026, 20,149 Jan Aushadhi Kendras were operational across India, with FY2025-26 sales of ₹2,252 crore in MRP value. Medicines under PMBJP are priced 50-80% cheaper than branded equivalents. The government has set a target of 25,000 Kendras by March 2027.




Leave feedback about this